Determination
of Protein Content in Kombucha Tea and Two Other Compounds
by Norbert Hoffmann
ABSTRACT
Protein concentrations of three liquids, Kombucha tea, skim
milk, and chicken soup were determined using a method developed by Bradford
(1976). The amount of protein found in Kombucha tea was nearly half that of skim
milk. It was suggested that this protein consists primarily of extra-cellular
enzymes excreted by the micro-organisms in the tea in order to break down
macro-molecules too large to penetrate the cell walls.
INTRODUCTION
Proteins are high molecular-weight polymer compounds composed
of a variety of amino acids which are joined together by peptide linkages.
Proteins are build from 20 kinds of amino acids. Amino acids have a carboxyl and
amino group in common and only differ in the side chains attached to the alpha
carbon. Each type of protein has a unique sequence of amino acids (primary
structure). This string of amino acids in turn is repeatedly coiled or folded
(secondary structure). The coils and folds are arranged in a three-dimensional
shape (tertiary structure) typical for each protein (Campbell, 1993).
Bradford (1976) has developed a fairly quick and sensitive
method for the determination of small protein quantities in solutions. This
method is based on the fact that the maximum light absorption of Coomassie
Brilliant Blue dye at various wavelength experiences a shift from 465 to 595 nm
when allowed to bind to protein. An increase in protein concentration results in
a corresponding increase in optical density or light absorbency. According to
Bradford the relationship is fairly linear with only a slight curvature.
MATERIALS
AND METHODS
Reagents: Bradford reagent consisting of Coomassie
Brilliant Blue G-250 and phosphoric acid dissolved in ethanol and distilled
water according to the method developed by M. Bradford (1976).
Protein and sample solutions: 1. Bovine serum albumin,
2. Kombucha tea 3. Skim milk, 4. Instant cream of chicken soup dissolved in 250
ml of cold water
Instruments: Test tubes, pipettes, cuvets,
spectrophotometer.
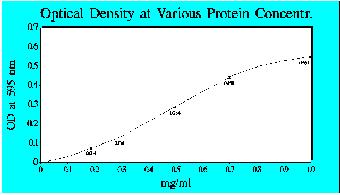
Procedures for the establishment of a standard graph:
Test tubes were filled with 0.1 ml of bovine serum albumin at the following
concentrations: 0.2, 0.3, 0.5, 0.7 and 1.0 g/l and one with 0.1 ml of distilled
water. 5 ml of the Bradford reagent was added to each of the solutions which
were allowed to incubate for 10 minutes at room temperature to allow binding of
the dye to the protein. Sufficient amounts of the individual solutions were
transferred to cuvets for the individual readings. The spectrophotometer was set
at 595 nm and the optical density indicator was zeroed using a cuvet with the
solution containing the Bradford reagent and distilled water. Readings were
taken for each of the remaining solutions. The entire procedure was repeated one
more time and the averages between the two tests were recorded in table 1 and
then plotted on a graph (chart
1). This graph was used as the standard reference for determining unknown
protein concentrations.
Procedures for determining protein concentrations for
sample solutions: Test tubes were filled with 0.1 ml of each of the
solutions; skim milk, soup mix, and "Kombucha" tea, also one was
filled with distilled water for establishing a base line. 5 ml of the Bradford
reagent were added to each tube. The solutions were allowed to stand for 10
minutes at room temperature to allow binding of the dye to the protein. Cuvets
were again filled with the solutions. The spectrophotometer was set to 595 nm
and the optical density indicator reset to zero using the solution with the
distilled water. After that, optical densities were determined for each of the
solutions with the unknown concentration of protein. Using the standard graph
established above, the protein concentration was determined.
RESULTS
Standard graph: As reported by Bradford, the
graph showing the relationship between the standard protein solution (BSA) and
optical density (chart 1)
was fairly linear. The curvature for BSA concentrations greater than 0.7 g/l
was, however, quite pronounced.
Protein Concentration of Three Solutions: At first,
readings of optical densities were obtained for 1:1 solutions. Since the results
were outside the linear range of the standard chart, a new series of tests were
made with 1:50 solutions. To obtain these solutions, one part of the three
samples was diluted with 50 parts of distilled water. Of this, 0.1 ml was mixed
with the Bradford reagent and readings of optical densities were taken with the
spectrophotometer and entered into table 2. Protein concentrations were read off
the standard graph (chart 1)
and multiplied by 50. The results were as follows:
Table 1: Protein Concentration of Three Sample Solutions
DISCUSSION
Standard Graph: The results indicated a mostly linear
relationship between optical density and protein concentration of BSA up to 0.7
g/l. There was a marked curvature beyond that which did not correspond to the
literature (Bradford). This may have been caused by inaccuracy during the
preparation of the solutions or the execution of the measurements.
Protein Concentration of Three Solutions: As expected,
both the skim milk and the chicken soup contained significant amounts of protein
(37.5 and 36.0 g/l respectively). The third solution, Kombucha tea, contained
about half as much protein as skim milk (15.0 g/l). This result was surprising
since the dye does not react to the proteins within microorganism cells. I
concluded that these proteins found in the tea must consist of various enzymes
secreted by the yeast and bacteria to break down the large molecules of
different nutrients in the tea which usually cannot enter cells directly, for
example sucrose (white sugar) and caffein. The tea was prepared following
published instructions and contained , according to Frank (1994), black tea,
sugar, several types of bacteria, yeast and compounds resulting from the
fermentation and other metabolic processes, namely acetic acid, glucuronic acid,
vitamins and ethanol. Since the culture continuously forms new layers of a
zooglea on the surface of the liquid, a certain amount of cellulose would also
be expected in the liquid. According to Bradford, none of the listed compounds
should have had any significant influence on the indicator dye. Boyd (1984)
stated that many microorganisms release extra-cellular enzymes into the liquid
around them to break down larger molecules into smaller ones which then can
cross the phospholipid membrane barrier for processing inside the cell.
Note: This research was carried out in the biology lab
at St. Olaf College in Northfield, Minnesota.
LITERATURE
- McGraw Hill dictionary of scientific and technical terms.
Fifth Edition. McGraw Hill Inc. New York. 1994.
- Campbell., N.A. Biology, 3rd edition, The Benjamin/Cummings
Publishing Company. 1993.
- Robert Boyd. General microbiology. St. Lois: Times Mirror/Mosby
College Publishing. 1984.
- Bradford, M., A rapid and sensitive method for the
quantitation of microgram quantities of protein utilizing the principle of
protein-dye binding. Reproduction Research Laboratories, Dept. of
Biochemistry, University of Georgia, Athens, Ga., Jan. 29, 1976.
- Frank, Günther. Kombucha, Healthy Beverage and Natural
Remedy from theFar East. Pub. House Ennsthaler. Steyr. 1994.

First published on the Internet June 18, 1998
<<BACK